ScreenshotsHere are some JNets screenshots and rendered networks. Each have a short explanation. If you want to see some real JNets examples, click the "Launch JNets" button on the right-hand side of the screen and the JNets applet will load an example network to for you to examine. NOTE: These screenshots appear more clearly in FireFox than Internet Explorer A large network rendered in JNets A network developed with some key JNets functions Interface for the dynamic editing of node and edge groups |
|
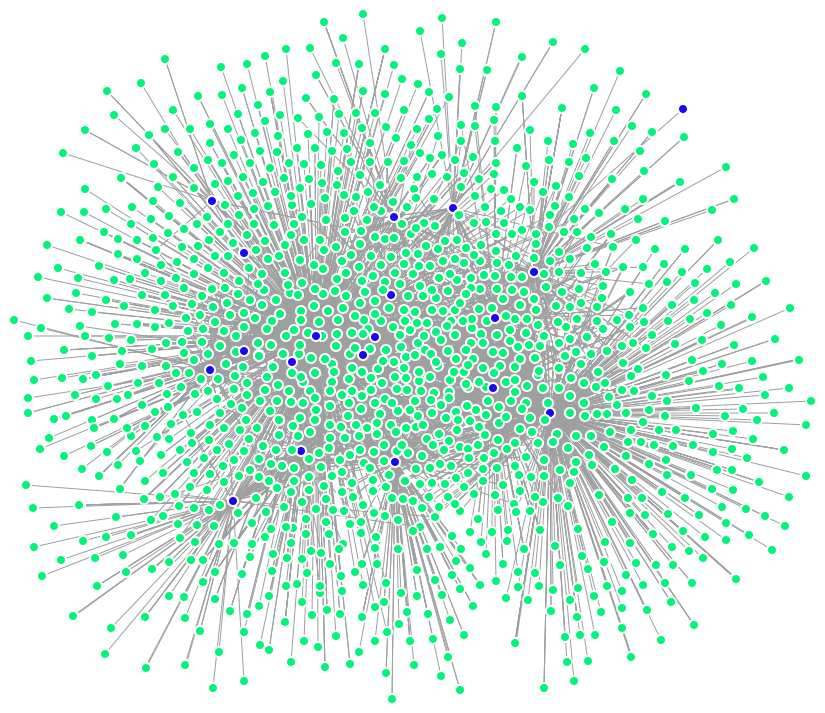
The HIV-1-Human Interaction Network
HIV-1 genes are shown in blue and Human genes are shown in green. The layout was produced using Large Graph Layout. This network consistes of about 1400 nodes and 3500 edges and takes about 2 seconds to load using JNets.
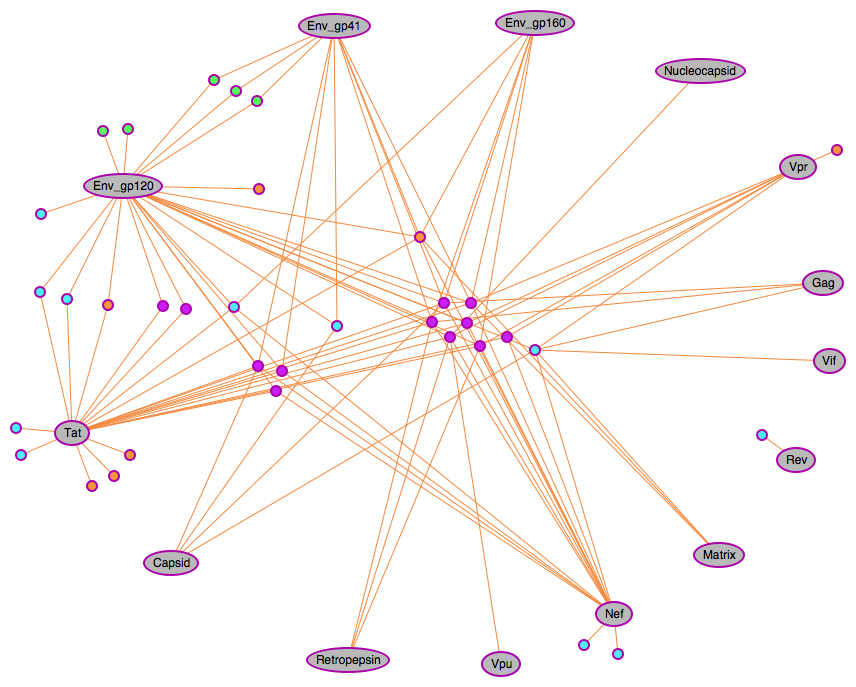
HIV-1 human interaction network after some editing
This network shows HIV-1-interacting human genes that are targetted by immunosupressant drugs. This network was made by editing the above network using JNets. The network has been filtered based on biological annotation we supplied JNets i.e. "drug target = true" and "drug-type= immunosuppressant"; the Human genes that did not fall in to these categories have been removed. The human gene nodes have been colored according to the HIV-1 interaction type, the HIV-1 nodes have been recolored and had their label turned on and the nodes have been rearranged.
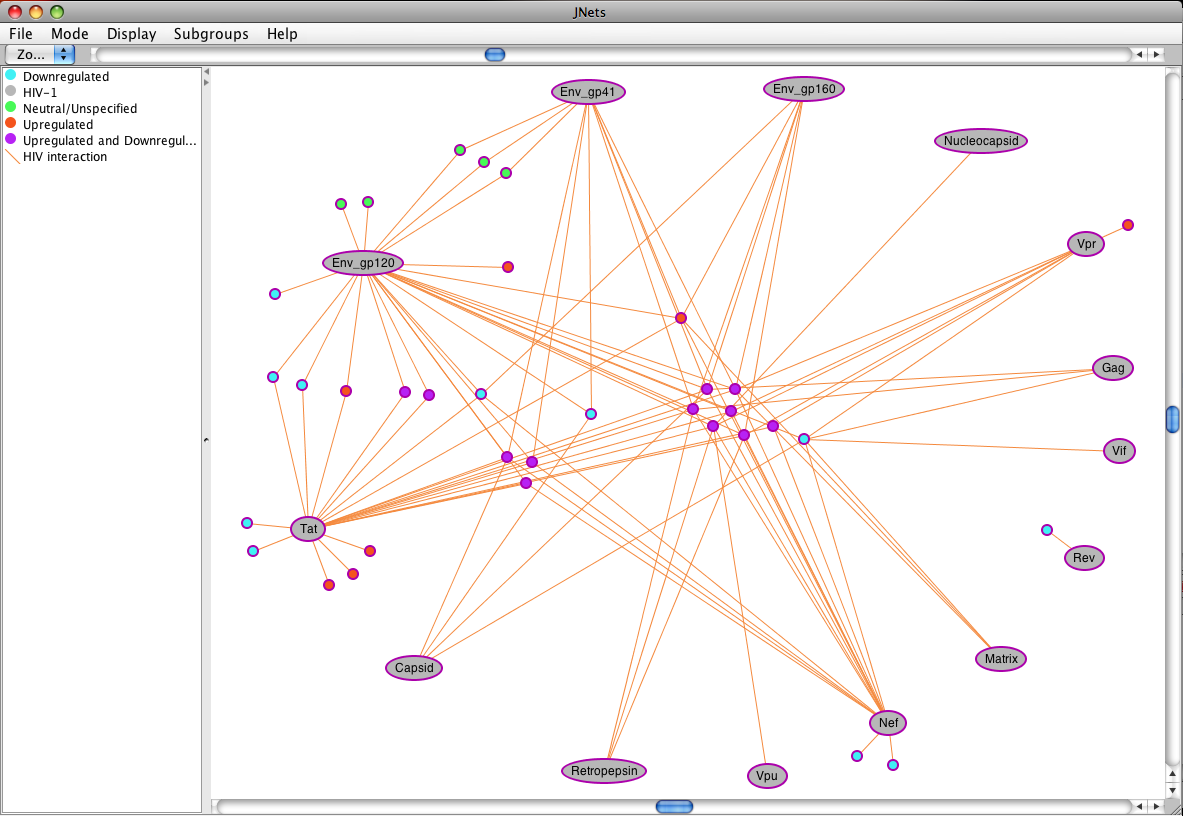
The JNets graphical user interface
This shows the above network as it appears in the JNets GUI.
|
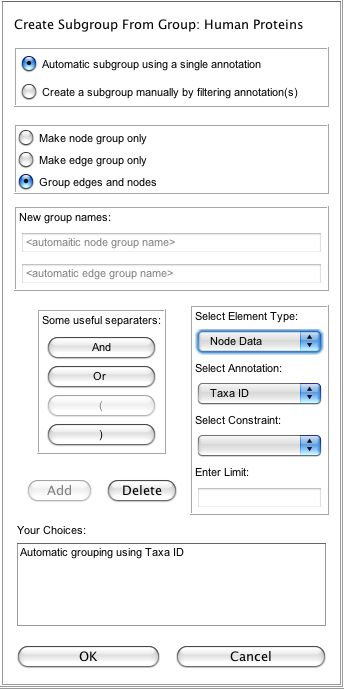
The JNets subgroups panel This interface is used to create groups of nodes and edges by filtering annotation. In the upper half of the panel there are some general options, including selection of automatic or manual groupings and what elements you want to group. The lower half of the panel is used to select annotations and limits for filtering these elements; it works a bit like "SQL", with specific queries separated by AND and OR keywords and brackets.
| 
|
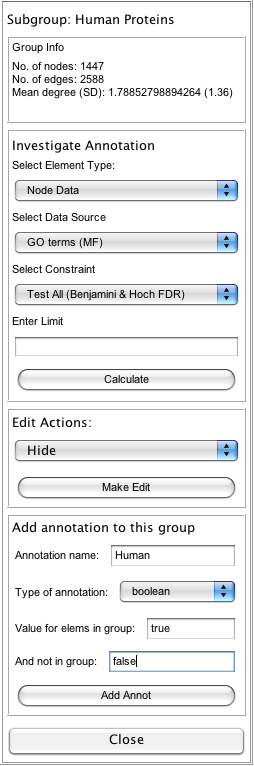 |
The JNets subgroup actions panel This panel is used to edit and investigate node and edge groups. At the top is a few statistics about the group you have selected. Below that is a tool for investigating the annotation within the group including over and under representation statistical tests. Further down is an edit-actions selection drop-down, used to alter, remove or isolate the group. At the bottom is a tool for adding annotation to a group, that you can then use to query and form subgroups from; this annotation will then appear in the saved output file (this can be a useful way of avoiding performing the same set of subgroupings to get to a certain node or edge group more than once). |
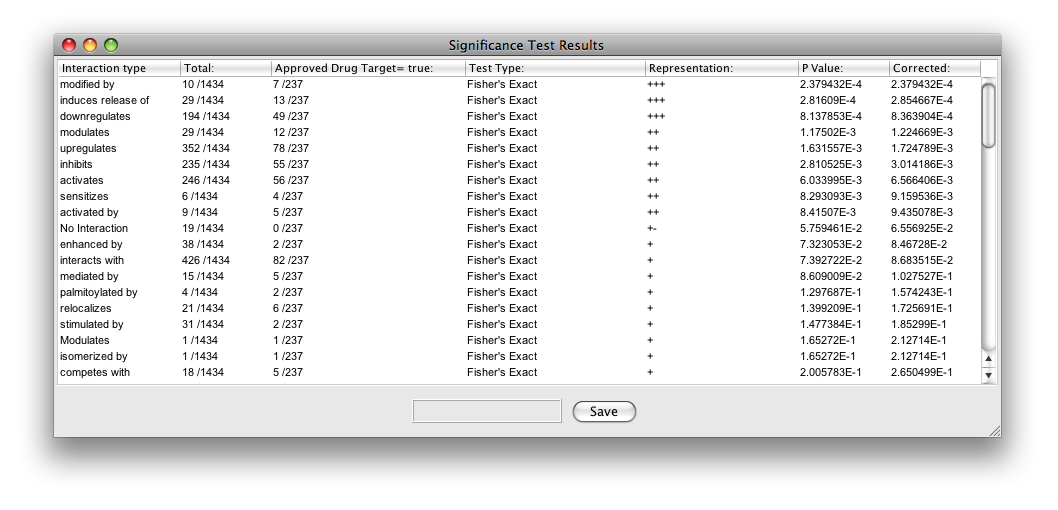
Example of a subgroup annotation investigation
This panel shows how the user can investigate annotations within a subgroup; accessed throught the subgroup actions panel. Here the user is examing the HIV-1 interaction types among a group of approved drug targets. The panel shows the counts of different interaction types and the results of a statistical significance test (including a false discovery rate).
|
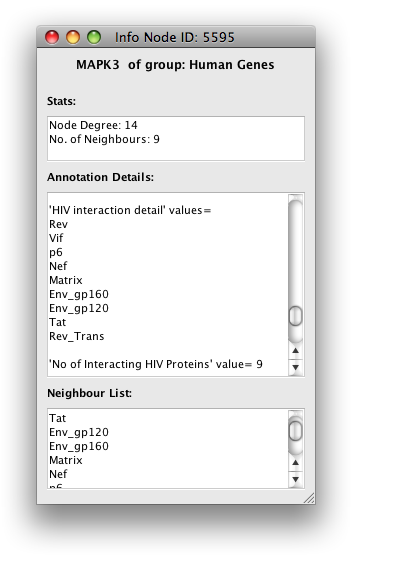
The node-info popup panel In JNets, right-clicking on nodes brings up a small menu, one option in this menu is to get a node-info popup. This popup is shown here; this includes some basic information about the node, such as it's ID, and name, details of any annotation that that has been assigned to that node and a list of other nodes that neighbour thye node in question (i.e. linked by an edge).
|